Following a suggestion I made on my personal blog, Alf Eaton has built a visual interface to the tag landscape that is collectively produced by del.icio.us users, basically feeding the “related tags” listings from del.icio.us into a TouchGraph browser. Here’s a screenshot I made, showing the current “lay of the land” around social software:
(layout hint: you can right-click the background to fiddle with the layout to get a clean capture)
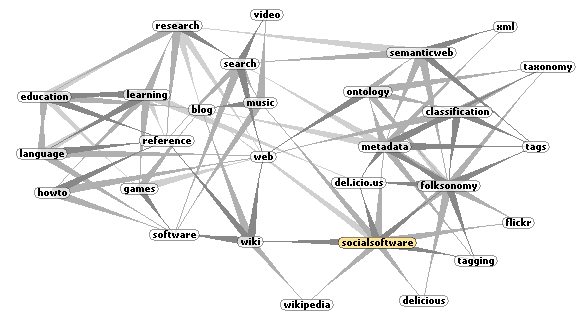
Alf’s tool lets you navigate around tags, expand topics you want to explore in more depth, and access the corresponding del.icio.us and Technorati tag pages. I think this could be a quite useful tool when you’re feeling your way into a new topic area and want to benefit from the knowledge of other people who have been around there. Think “Okay, so what is this newfangled “folksonomy” thing all about? Does it relate to anything I’m already familiar with?”
Subscription mapping
And for something completely different, Paolo Massa then asked Alf for a social network map based on users’ del.icio.us subscriptions, which wasn’t too long in coming. Because users can subscribe to tag feeds (you can recognize those because they start with an asterisk), people and topics are also connected, yielding a “Who and What” map showing both types of objects in the same graph. Because tag subscriptions are uncommon, it might actually be more illuminating to connect people and topics based on tagging habits rather than subscription.
This social visualization tool works wonders in the way of revealing implicit information that is otherwise hard to see. For instance, if you start with Liz’s subscription network, and then double-click the “sebpaquet” node, you’ll immediately see that we are both tracking links from Howard Rheingold, Joi Ito, Jay Bibby, and Clay. The advanced options let you do things such as displaying only nodes that are no more than, say, two degrees away from the node you last clicked, letting you get a sense of the immediate neighborhood of a person.
(for related prior art, see also the Touchgraph LiveJournal browser, which operates on a dataset that is at least an order of magnitude larger)